PCV traffic still below pre-pandemic levels
Bus and coach traffic levels rose between 2021 and 2022 but are still below 2019 figures, according to the latest government statistics.
The DfT figures show that all motor vehicle types, except lorries, saw an increase between 2021 and 2022. However, overall traffic remains below pre-pandemic levels in 2019. Car and PCV traffic saw some of the biggest increases between 2021 and 2022, but still remained below pre-pandemic levels by -7.2% and -12.3%, respectively.
Bus and coach traffic rose by 14.4% between 2021 and 2022, to 2.1 billion vehicle miles. Compared to 2019, bus and coach traffic fell by 12.3% in 2022. Annual traffic figures from the DfT have shown bus and coach miles travelled in Great Britain generally saw year-on-year falls in each year between 2012 and 2019. Following a sharp decline in 2020, traffic levels increased in 2021 and 2022, but still remain lower than the pre-pandemic levels.
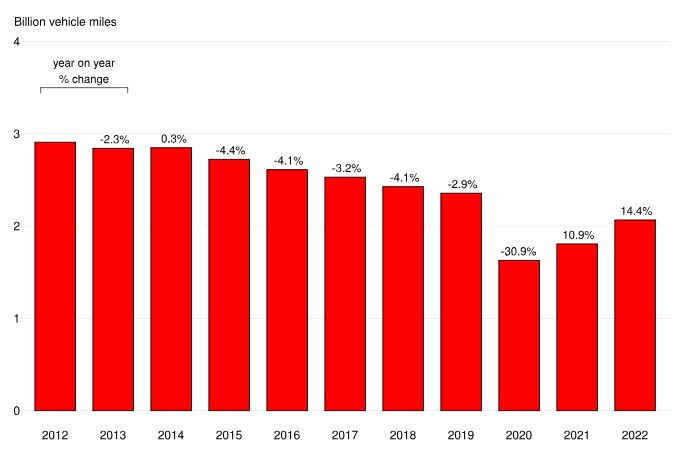
This bar chart shows the percentage of year-on-year change in traffic levels
During 2022, bus and coach traffic was lower in every month than pre-pandemic levels for the equivalent months in 2019. Bus and coach traffic was between 7% and 17% lower than the levels for the equivalent months in 2019.
Annual traffic statistics are compiled using data from around 8,000 roadside 12-hour manual counts, continuous data from automatic traffic counters and data on road lengths. Buses and coach consisted of 1% of traffic, according to the latest statistics.